The Obumeconomy in four charts
Can we survive four more years of national suicide? Doug Ross offers four simple charts showing Obama’s disastrous results from his “fundamental transformation” of America.

From Doug Ross Journal:
If you know someone disconnected from politics, unmotivated to vote, or otherwise sitting on the fence, please share with them the following four graphs. And then ask them one simple question, which I’ve listed below.
• Household income fell more in recovery than during recession
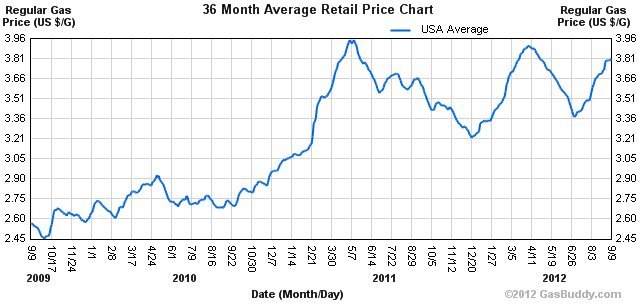
• Gas prices have more than doubled since Obama took office:

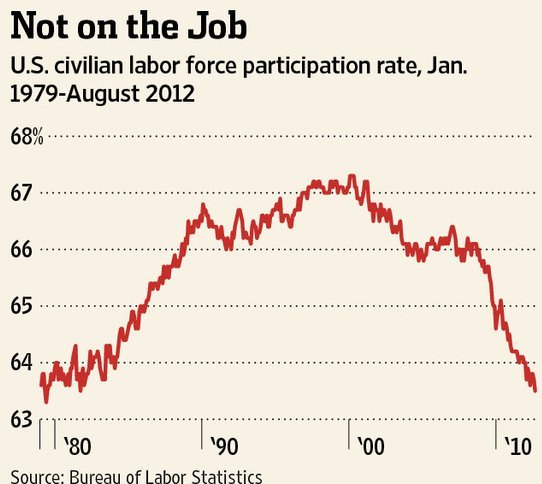
• Labor Force Participation Rate Goes Backward to 1981

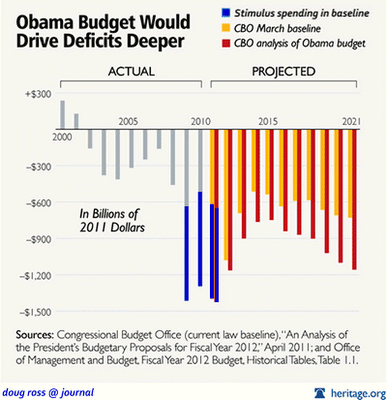
• The ‘One-Time’ Stimulus Became Part of the Federal Baseline Budget

Unfortunately, that so-called “one-time” spending spree was built into each and every year’s budget — and is driving America to a Greece-style debt crisis.
That one simple question to ask: Can we survive four more years of this?
Just click the button to email:
Help Make A Difference By Sharing These Articles On Facebook, Twitter And Elsewhere:

