Fantasy Climate Change – Models Wrong for Over 25 Years

In every single case, the observed trend lies below the model average trend.
By Paul C. “Chip” Knappenberger and Patrick J. Michaels at Cato @ Liberty
The Current Wisdom is a series of monthly articles in which Patrick J. Michaels and Paul C. “Chip” Knappenberger, from Cato’s Center for the Study of Science, review interesting items on global warming in the scientific literature that may not have received the media attention that they deserved, or have been misinterpreted in the popular press.
Question: How long will the fantasy that climate models are reliable indicators of the earth’s climate evolution persist in face of overwhelming evidence to the contrary?
Answer: Probably for as long as there is a crusade against fossil fuels.
Without the exaggerated alarm conjured from overly pessimistic climate model projections of climate change from carbon dioxide emissions, fossil fuels—coal, oil, gas—would regain their image as the celebrated agents of prosperity that they are, rather than being labeled as pernicious agents of our destruction.
Just how credible are these climate models?
In two words, “they’re not.”
Everyone has read that over the past 10-15 years, most climate models’ forecasts of the rate of global warming have been wrong. Most predicted a hefty warming of the earth’s average surface temperature to have taken place, while there was no significant change in the real world.
But very few people know that the same situation has persisted for 25,  going on 35 years, or that over the past 50-60 years (since the middle of the 20th century), the same models expected about 33 percent more warming to have taken place than was observed.
We can blame the lack of public awareness of this scientific farce squarely on the U.N.’s Intergovernmental Panel on Climate Change (IPCC). In the Summary for Policymakers, the most-read section of its brand new Fifth Assessment Report (released back in late September), the IPCC had this to say about climate model performance:
Climate models have improved since the [Fourth Assessment Report published in 2007]. Models reproduce observed continental-scale surface temperature patterns and trends over many decades, including the more rapid warming since the mid-20th century and the cooling immediately following large volcanic eruptions (very high confidence).
Followed immediately by this:
The long-term climate model simulations show a trend in global-mean surface temperature from 1951 to 2012 that agrees with the observed trend (very high confidence). There are, however, differences between simulated and observed trends over periods as short as 10 to 15 years (e.g., 1998 to 2012).
All in all, a rather glowing assessment.
Glowing, but not so hot.
We’ve calculated the trend in the global average surface temperature simulated to have occurred starting in every year since 1950 and ending in 2012 for every* run of every climate model used in the new IPCC report. In Figure 1, below, we compare the average (and spread) of these 106 model runs with the observed trend during each of the same periods.
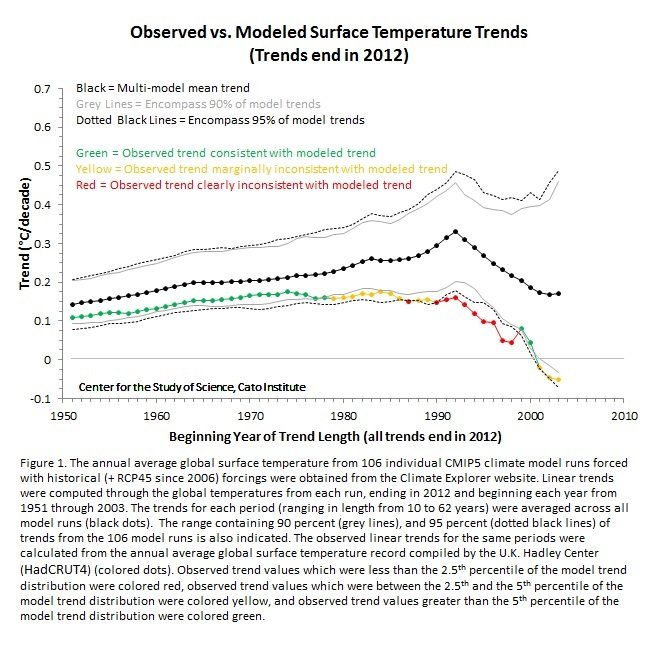
In every single case, the observed trend lies below the model average trend. For the trends of length 16, 17, 18, 19, 20, 21, 22, 23, 24, and 27 years, the observed trend lies outside (below) the range which includes 95 percent of all model runs (indicated by red in Figure 1). In statistics, this means that the observed trend is inconsistent with the collection of model trends. For trends of length 10, 11, 12, 25, 26, 28, 29, 30, 31, 32, 33, and 34 years, the observed trend lies outside (below) the range encompassing 90 percent of all model trends (indicated in yellow in Figure 1). We call this marginally inconsistent with the models. For trends of length 13, 14, 15, and all lengths greater than 34 years, the observed trend is consistent with the collection of model trends (indicated by green in Figure 1), although it lies pretty far out in the low end of model projections in every case.
For what it’s worth, this same IPCC report has verbal descriptors of their published probability figures. When they say something has a 90 percent probability, it is “virtually likely” (whatever the heck that means!), and a 95 percent probability is “extremely likely.” So, analogously, one could apply those same words to our 90 and 95 percent probabilities of model failure over certain lengths of time. But because English is our primary language, we’re stating that the models are “marginally inconsistent” and “clearly inconsistent” with reality in these periods.
 This hardly seems to fit the IPCC description that “[m]odels reproduce observed continental-scale surface temperature patterns and trends over many decades” or is grounds for having “very high confidence” that the “model simulations show a trend in global-mean surface temperature from 1951 to 2012 that agrees with the observed trend.”
And things aren’t going to get better anytime soon (if ever). In fact, they are about to get much worse.
That’s because the longer global temperatures just sort of plod along without rising much (new research suggests that such a period may extend for another 20 years or so), the more established (and entrenched) the observed/model mismatch becomes.
In Figure 1, above, our analysis ended with the last full year of available data, 2012. With three-quarters of 2013 already in the books, we can make a pretty good guess as to what the global average temperature anomaly is going to be at years’ end, and perform the same analysis we described above, but ending in the year 2013 instead of 2012. By the looks of things, 2013 is going to continue the string of years (going on 17 now) during which there has been virtually no change in the global average temperature and thus making the model performance even worse.
Figure 2, below, gives the updated result.
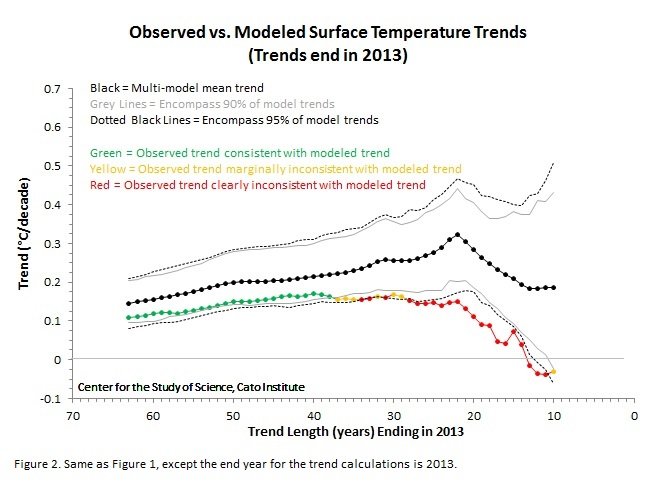
For data ending in the year 2013, the category of marginal inconsistency extends out to 37 years and is now flirting with lengths exceeding 50 years, and trends of lengths 11-28, 31, 33, and 34 (!) are clearly inconsistent with the climate model simulations.
In other words, over the past third of a century—the period with the greatest amount of anthropogenic greenhouse gas emissions—the behavior of the real world (i.e., reality) falls far below the average expectation of climate models and, in fact, is clearly inconsistent with the range of model results. Less than 2.5 percent of model runs show that global warming is really global luke warming to the degree that real-world observations indicate.
Basically, the models don’t work.
This reality ought to be enough to stop the anti-fossil fuel (via carbon

Green Fascism
dioxide emission restrictions) crusaders in their tracks.
But thus far, it hasn’t, aided in part by the obfuscations of the United Nations (through the IPCC reports) and our own federal government (via reports such as the National Assessment of Climate Change).
If the people currently in charge of these organizations can’t face reality, then it is high time to replace them with others who can.
………………………………….
* We should say, every run that was available through the Climate Explorer website. Climate Explorer had 106 individual model runs, while the IPCC states it has 113 (we have been unable to identify the other 7 runs). The difference should have minimal impacts on our analysis.
This work by Cato Institute is licensed under a Creative Commons Attribution-NonCommercial-ShareAlike 3.0 Unported License.
Also please consider:
Increasing clouds of doubt & storms of skepticism for climate alarmists
Obama’s War on Coal & Your Standard of Living
Now It’s Global COOLING! Record Arctic Ice – Grows 60%
Obama’s War on Jobs
“War on Coal Is Exactly What’s Needed” – Obama Anti-Energy Adviser
Obama’s Crown Jewell of Thought Police
Hot Lies Disputed by Cold Facts
$100 BILLION Blown on Faux “Green” Jobs
The Audacity of Deceit – Media Will Push Obama’s Climate Lies
EPA Climate Fascism
U.N. Continues Push for Global Hegemony with Climate Hoax
Continuing Collapse of Global Warming Hoax
Mindless “green” indoctrination of our children
Obama’s Clean-Energy Dirt – Stealing You Blind for a Good Cause?
Manufactured Crisis of Global Warming aka Climate Change
$11,000,000.00 Spent Per “Green” Job Ceated
Let My Energy Go! Obama Depresses Economy With Green Agenda
Obama warned us he would make electricity rates ‘skyrocket’
Billions Burned on Obama’s Green Energy
Let My Energy Go! Obama Depresses Economy With Green Agenda
Consumers pay 38% extra for ‘renewable’ energy mandates
Obama pushes up oil, gas and electric rates as he promised
Chu on this – Obama administration doesn’t care about high gas prices
Steve Jobs and the anti-jobs president
The New Robber Barons and Their Thief in Chief
Obama’s Green Energy Fail
Obama’s Green Corporate Welfare Funds Foreign Jobs
You’re Getting Gassed by EPA Lies About Ethanol
O’s Nominees to Push Failed Green Agenda, Continue Higher Energy & Gas Prices
Green Scam – Keeping You Afraid While Stealing You Blind
Obama’s Clean-Energy Dirt – Stealing You Blind for a Good Cause?
New York’s “Sustainability” Plan: aka “Agenda 21”
Sustainability Marxism
85% of Americans clueless on Agenda 21
Green Nazis
Frightening Quotes from Environmentalists
MORE Frightening Quotes from Environmentalists
Sustainable Nonsense
UN IPCC Report Shows Man-made Global Warming is a Hoax
Real sustainability versus activist sustainability
Let Them Eat Environmentalism – Starve the People, Save the Planet
Governmental Global Warming Lies Heating Up
The New Robber Barons and Their Thief in Chief
Government of, by and for the activists
EPA Funds Green Groups That Sue The Agency To Expand
The Speed of Progressivism
UN Agenda 21 – Coming to a Neighborhood near You
Agenda 21-The U.N. Plan for Your “Sustainable” Community
LOL – “Green” jobs includes garbage men, oil lobbyists
$9 million dollars per green job – Are we insane? – Four more years of this?
Obama green jobs cost over $13 million each – that’s a jobs plan
Obama’s “green” jobs cost $6.7 million per job
Help Make A Difference By Sharing These Articles On Facebook, Twitter And Elsewhere: