Evil Is Still Lurking In The Shadows Of That ‘Strong’ Housing Number
November’s annualized single family starts – actually lower than the starts in November of 2010 (454,000).
Daniel Alpert at EconoMonitor
The thinly traded equity markets took off today on the strength of some very good November numbers out of the Census Department on the U.S. home building sector (also, among a few other things, an absence of bad news from Europe – but that’s another matter).
The numbers were quite good on both the starts and permits side, showing annualized, seasonally adjusted volume of 685,000 and 681,000, respectively. Actual, unadjusted, starts in November were 51,800 for the month. 50,400 permits were drawn in November. This is up, in both cases, by about 10,000 units (20%) from November 2010.
Ax e-third of starts and permits were multifamily rental units. But virtually ALL of the increase over November 2010 was in multifamily construction, on an unadjusted basis. November’s annualized single family starts number of 447,000 was actually lower than the starts in November of 2010 (454,000).
New home construction represents a small fraction of overall residential real estate sales in the United States and is far more reactive to price changes. A homeowner of an existing home may choose not to list his home for sale at a market clearing price – or any price – under distressed market conditions, but a home builder needs to build at a market clearing price in order to stay in business. Nevertheless, the importance of the sector (whether rental or owner-occupied) rests in its connection to job creation in the construction industry. So any pickup is very much to the good.
To fully appreciate the significance of the November numbers, one must delve a bit deeper into the numbers themselves and what is going on in the rest of the housing sector.
There has been a significant drop off in the visible inventory of existing homes available for sale. Nationally, the number of such homes has fallen over the past year by 21.3% to 2.01 million units. There is some variance in the degree of decline regionally, but it is pretty much across the board and there is some measurable correlation between improvement in new home starts and the markets in which inventory has contracted the most.
It is therefore not surprising that demand for new housing owner-occupied units should be holding up – even in a typically bad month for such sales.
And given the tightness of financing and the difficulty many buyers face in coming up with down payments, it is also not surprising that many are being forced (or electing) to move into the rental sector.
But therein lies the rub in today’s numbers and in the sector in general.
Visible existing home inventory is not down for the right reasons (which would include a tightening in the inventory of unoccupied vacant units). It is down because of the enormous backlog in the aggregate “shadow inventory” of homes that are either in foreclosure, or are heading in that direction. The shadow inventory has grown because of a systemic and/or conscious slowing of the foreclosure and liquidation process in a market challenged by loan documentation problems and the general reticence of lenders to push collateral into the for-sale market at prices that result in sizable losses.
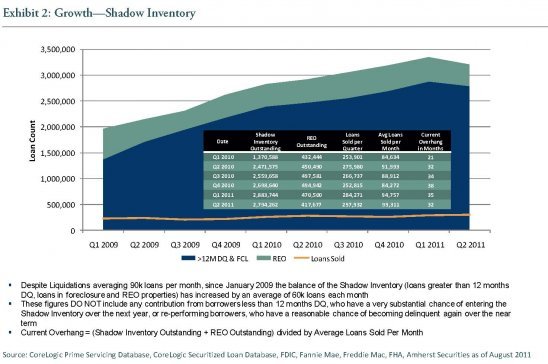
To help readers fully comprehend the dimensions of the shadow issue, I offer the following chart taken from the testimony of Laurie Goodman of Amherst Securities given to a congressional committee in September. Goodman is perhaps the preeminent analyst of the U.S. mortgage market and her data and analysis is relied upon extensively on Wall Street and in the housing industry at large.
Goodman placed the the total number of loans that that have either been taken into REO by lenders or were more than 12 months delinquent at Q2 2011 at over 3.2 million. This is a volume that would take 32 months to dispose of at the current pace of liquidations and is – unfortunately – what is coming down the pike going into 2012. Note that this figure does not include mortgages that are LESS THAN 12 months delinquent.
The following graphic illustrates the above.
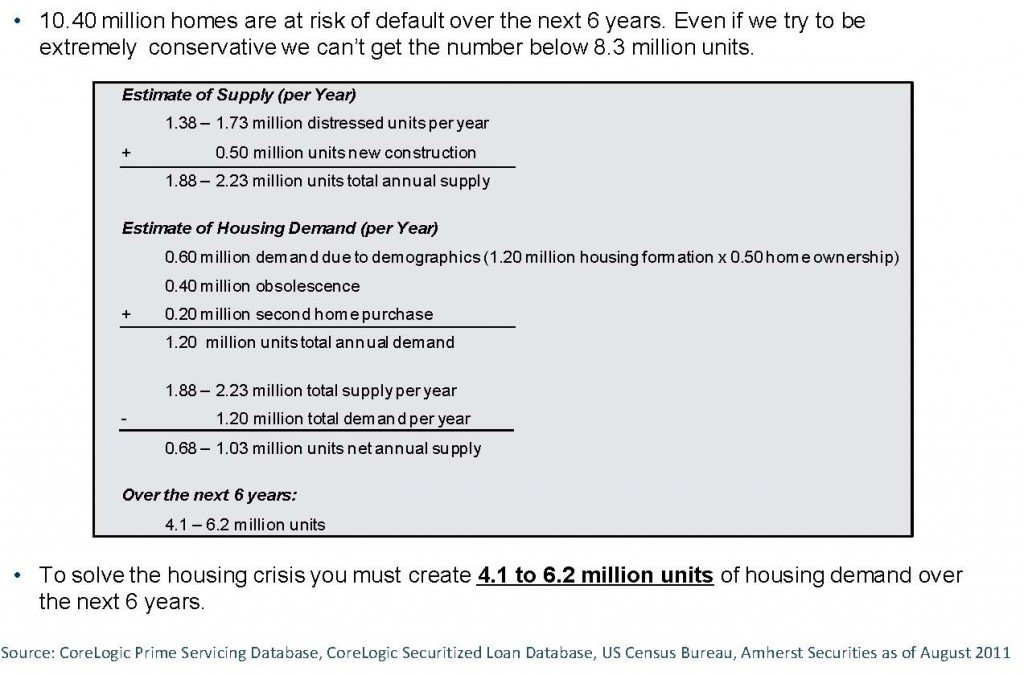
Goodman’s testimony then went on to project the demand necessary to absorb the shadow, and additional defaulting inventory. The upshot: based on likely demand (and she is quite generous in assuming a recovery in household formation that so far has not been seen), demand falls short by between 4.1 million and 6.2 million units over the next six years. See the calculations below:
So the problem is that even if visible existing inventory has declined and there improved demand for newly constructed units, the likelihood is strong that it is temporary. Nevertheless, home builders should make hay while the sun shines and jobs created as a result are manna from heaven.
Help Make A Difference By Sharing These Articles On Facebook, Twitter And Elsewhere:


