CBO REPORT – OMG! – Slower Growth, Higher Unemployment

The report provides a dismal outlook for the economy. I think the CBO report has created a big headache for a good number of folks in D.C. Most of them are running for office this year. They certainly won’t be able to wave the CBO report as a measure of how well they are doing.
By Bruce Kasting
The Congregational Budget Office (CBO) is out with its annual report. It’s a blockbuster. This 165 page monster is filled with dozens of charts, graphs and detailed projections. It will be talked about for weeks. The report provides a dismal outlook for the economy. There is one data point I’d like to focus on.
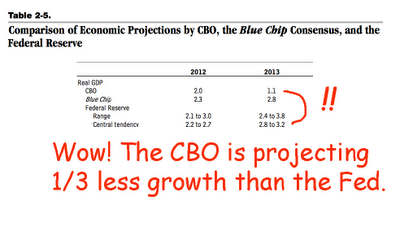
Here is the CBO forecast for real GDP for 2012 and 2013:
The 1.1% Real GDP number for 2013 surprised me. The CBO’s expectations are way under those of both the “Blue Chip” economists and the Federal Reserve:
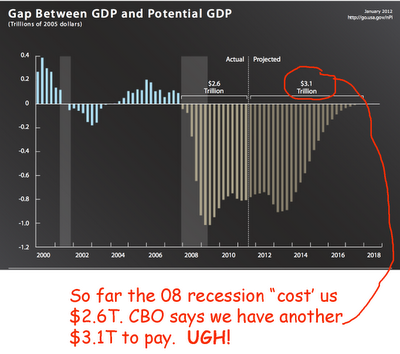
What does it mean if the economy is going to slow, as CBO now thinks? Some consequences:
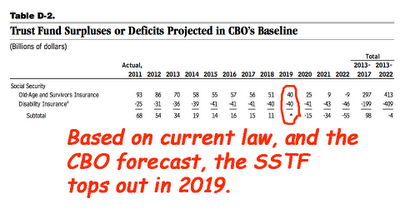
The CBO now forecasts Social Security to run into trouble in just a few years. This is a very substantial change in the outlook for SS. Changed fortunes make it a certain that America’s favorite entitlement program will be on the table for a significant re-vamp.
The CBO has answered two critical question:
1) In what year does SS first goes into deficit (including interest)?
2) What is the size of the SS Trust Fund when #1 has been achieved?
Key data is here:
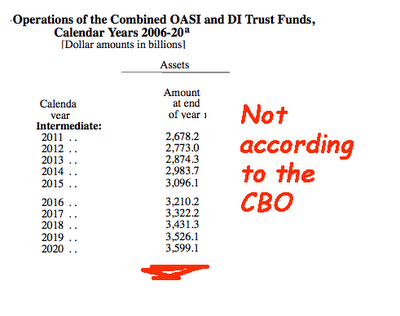
Using this information, we can estimate the Trust Funds (TF) balances over time, and compare them to what SS forecast in its report to Congress ten-months ago:
SSTF’s “Intermediate” (Base) case:
The bottom line is that the SSTF is going to top out three years ahead of “schedule” and be $800B shy of what it was “supposed” to be.
I think the CBO report has created a big headache for a good number of folks in D.C. Most of them are running for office this year. They certainly won’t be able to wave the CBO report as a measure of how well they are doing.
- Bruce Krasting: I worked on Wall Street for twenty five years. This blog is my take on the financial issues of the day. I was an FX trader during the early days of the ‘snake’ and the EMS. Derivatives on currencies were new then. I was part of that. That was with Citi. Later I worked for Drexel and got to understand a bit about balance sheet structure and corporate bonds from Mike Milken. I was involved with a Macro hedge fund later. That worked out all right, but it is not an easy road. There was one tough week and I thought, “Maybe I should do something else for a year or two.” That was fifteen years ago. I love the markets. How they weave together. For twenty five years I woke up thinking, “What am I going to do today to make some money in the market”. I don’t do that any longer. But I miss it. View my complete profile
- Editor’s note:
- Mercatus scholars and economists Veronique de Rugy and Jason Fichtner weigh in on the CBO report suggesting the likely reality is far worse than the report suggests.
VERONIQUE DE RUGY:
“The CBO baseline only takes into consideration current law, so it counts the savings from the expiration of provisions like the Bush tax cuts, doc fix, and AMT patch,” said Veronique de Rugy. The alternative baseline is what we should be looking at, because it’s a more realistic vision based on past experiences. The savings are not likely to materialize because we’ve been extending these types of provisions for years, and are likely to do so again.”
“Unfortunately the alternative baseline is much worse. We’re only a few years away from the biggest explosion of spending since the second world war, and Americans are in denial if they think that the situation can be fixed without radical changes,” said de Rugy. “The U.S. is headed toward bankruptcy. All we have to do is look to Europe to see what happens when countries refuse to face reality.”
JASON FICHTNER:
“For those concerned about our fiscal future, the CBO report is usually a reality check on the cost of servicing our debt” said Fichtner. “The best case scenario is that it would stay constant or lower slightly due to a pickup in economic growth and low inflation and borrowing costs. The more likely scenario is red ink for as far as the eye can see. This means the cost of servicing our debt will begin to take over our ability to pay for what we rely on like defense, education, Social Security, and more.”
“This is the first major report of the year that shows where spending is headed,” said Fichtner. “It’s what the Congress will use as a comparison to the OMB baseline when the president releases his budget on February 13th.”
Help Make A Difference By Sharing These Articles On Facebook, Twitter And Elsewhere:


